 Paper 360
What is reliability and how can you measure it? To create a reliable manufacturing culture, you first need to agree on what reliability is, the benefits of improving it, and how it will be measured.
In this article, we define reliability as the ability of a manufacturing process line, or equipment, to perform up to its designed capacity. If the capacity was designed to manufacture 500 widgets per eight-hour shift, but the actual quality volume output was 472 widgets during a shift, then you achieved a reliability of 94.4 percent during that shift.
The components of overall production/manufacturing efficiency (OPE/OME) are:
- percent quality volume manufactured
- percent time manufacturing line is running
- percent speed of set speed
In other words, the formula is:
% Quality x % Availability x % Speed = OPE/OME
We prefer to use the term Overall Production Reliability (OPR) or Overall Manufacturing Reliability (OMR). This means that it covers both operations and maintenance. So, not only does it include equipment reliability, but it also includes operating process reliability (such as operating at the right speed and pressure or having the right packaging material).
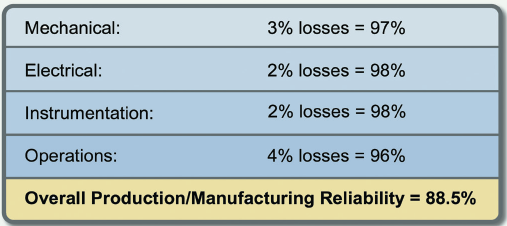
Using OMR as a common measurement avoids those “happy islands” where each department has the illusion of being good even though the total performance is not very impressive. Figure 1 is an example from a plant where each department worked in silos and reported on their departments’ reliability. Each department thought they were very good, with little room for improvement. Each was in the high 90s, so the OMR would be 88.5 percent. For this manufacturing line, this is about 7 percent below good performance.
In highly automated manufacturing, the first focus is often on equipment reliability. This is because if equipment is operating without any problems, you are making your product. If it is not, you are not making any product.
ORGANIZATION AND MISSION
To create a reliable manufacturing culture, you must agree to work in a close partnership between operations and maintenance, including stores and engineering. This should start with a common manufacturing mission that clearly expresses this. Then you need to design and implement all work management processes with the agreed-upon mission statement as a guideline.
For instance, a manufacturing mission statement between operations and maintenance should be worked out between the parties and could be: “In an equal partnership between operations and maintenance we will safely deliver continuously improved manufacturing reliability.”
The maintenance organization’s mission statement would then be: “In an equal partnership between operations and maintenance we will safely deliver continuously improved equipment reliability.”
The operation organization’s mission statement would then be: “In an equal partnership between operations and maintenance we will safely deliver continuously improved operating process reliability.”
This would express a culture change from operations and maintenance working in silos to growing into equal partners. Therefore, lost production will not be recorded by each department because it often leads to a blame game. Instead, triggers are set to select which problems require a process of root cause problem elimination (RCPE). In this process you do not ask “who?”; instead, you ask “why?” This is just one of many changes you’ll need to make to accomplish a reliable manufacturing culture.
It also changes the common view that the maintenance organization delivers “service” to the operations organization. Instead, the maintenance organization delivers equipment reliability. That makes sense because the product of maintenance is not service, it is reliable equipment.
COMMON GOALS
The organization must also agree on common lagging (or results) indicators. Often, the maintenance organization is measured by budget and costs while operations is measured by produced quality volume. Instead, common lagging indicators should be:
- safety
- overall manufacturing reliability
- manufacturing cost per unit
Each department can have its own leading indicators to drive performance toward the common lagging indicators. For the maintenance organization, these could include average vibration level trend, preventive maintenance compliance (only meaningful if content is right), percent planned work, percent schedule compliance, and more.
WHAT ARE THE BENEFITS?
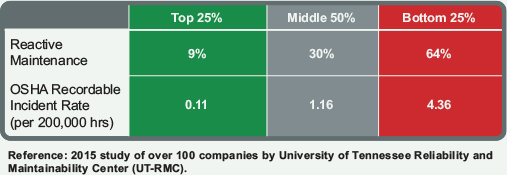
The major benefits of improved OMR include safety and increased throughput of quality volume product. Many studies by IDCON and other organizations, including BEMAS in Belgium and the University of Dayton, show that there is a strong correlation between safety and reactive maintenance.
The example (Figure 2) here shows that companies that reported 64 percent reactive maintenance had an OSHA recordable incident rate (RIR) of 4.36, while companies reporting 9 percent reactive maintenance had an OSHA RIR of 0.11.
It is important to understand the value of improved OMR. In addition to being a safety and physical asset, it also benefits the revenue side of the maintenance organization. Creating an OMR-driven organization does not require much capital work. Necessary investments include education, training, and outside support to help you do better with what you already have.
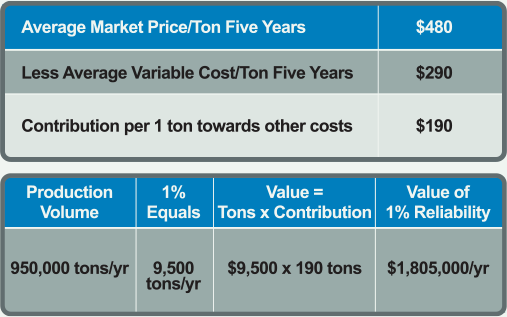
Yes, I know from decades of experience that outside support is needed. Many organizations are in a gridlock and need an outside neutral coach to get it done within a reasonable time frame. You need to estimate the value of improved OMR as an input to the business case you will develop and present it to decision makers. We advise to not estimate too much. Even if the potential to increase OMR is 7 percent, instead show the value of 1 percent improved OMR. Figure 3 shows how that would work.
If the average market price for your product (in this example, by tons) is US$480, and the average variable cost over the same period to make one ton is US$290, then the contribution toward fixed costs is US$190 per ton.
Let’s say the plant produced a steady average of 950,000 tons per year. A 1 percent increase is 9,500 tons per year times US$190 per ton, which would increase revenue by US$1,805,000 per year.
Even if you cannot sell more tons, improved OMR results in faster and safer manufacturing throughput. For example, “Just-in-Time Manufacturing” must have high OMR.
When you agree on the mission and the necessity to improve OMR, some suggested steps include:
- Educate, train, and explain the benefits and what the future will look like.
- Assess how good you are and how good you can become.
- Develop an action plan for the next five years.
- Appoint a coach who can not only teach, but who can also provide on-the-job training/coaching with key people such as managers, planners, and frontline leaders.
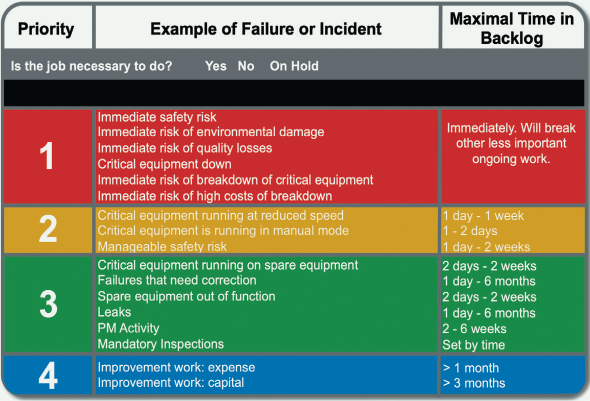
One of the most common improvement opportunities is when a mill is accepting too many emotional priorities from requestors, and operations is used to overprioritizing work requests to get the job done even before it is necessary. The solution is to develop a clear and simple priority guide. Keep it simple and use only two priorities: job must be done now; latest date completed. Define together what constitutes emergencies and how long different situations can be in the backlog. See the example in Figure 4.
To improve the work management process (WMP), key people in operations and maintenance should develop it together. A complete WMP with each step documented and assigned to people can look overwhelming. We propose that you start with an easy-to-understand overview, and from there you would detail each step. An overview can look like Figure 5, when you decide where operations and maintenance employees are involved. It is often advantageous to have the function of a maintenance-operations coordinator reporting to operations as well as leading scheduling meetings.
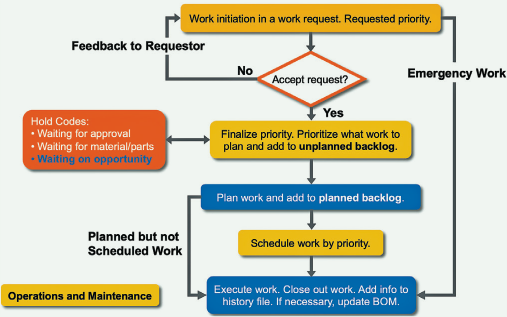
Figure 5: Simplified example of a Work Management Process.
HOW DO YOU START?
Of course, there are many ways you can work to move your organization toward a reliability culture and a good partnership between operations, engineering, and maintenance (including stores). Your plant manager needs to drive this initiative and get the key positions in the manufacturing organization on board to jointly support this change.
Some improvement initiatives fail to fully deliver potential results, while other initiatives are very successful. Successful organizations have achieved between 1–10 percent increased manufactured quality volume followed by 5–15 percent lower maintenance cost.
Step 1: Educate and Inform. The most successful organizations we have worked with always started with a one- to two-day seminar with key operations, maintenance, engineering and stores managers, and hourly employees in attendance. The seminar explains the benefits for the whole organization, why an improvement initiative is needed, what the best reliability and maintenance practices are, and how leaders plan to implement. It is important to first agree on the right things to do, and after that decide how you are going to take each step on your journey toward a reliability culture. Therefore, the seminar focuses on the right things to do and getting feedback and agreement on these things. It is easier to get agreement on the right things to do than how to do them in detail.
After the seminar we ask for formal feedback and self-evaluation from attendees. The feedback involves the organization firsthand and provides valuable information for Step 2.
Step 2: Current Best Practices (CBP) Assessment. It is likely that many employees already know what to do, but you need to get an objective view to find the gaps between how good your organization is and how good it can become. Before you start a journey, it is necessary to know where you are when you start and where you are going. All our successful initiatives have included a Current Best Practices (CBP) assessment followed by developing, documenting, and communicating the implementation plan. This is done together with owners that are assigned to each improvement subject that has been identified during the CBP assessment.
Step 3: Implement. There are seldom any surprises about what needs to be done. The CPB assessment serves as the tool to educate, increase awareness, and bring the organization together in a reliability culture. Improvements will not be sustainable unless the CBP assessment is repeated every 12 to 18 months. These reassessments drive the improvement work and keep it alive. We compare this to better safety. If repeated safety assessments are not done, safety will not improve—it will decline. The most commonly identified reliability and maintenance processes for improvement are:
- Preventive maintenance content and execution is not right or up to date and consequently not executed.
- Work management for which prioritization, description of work, and planning and scheduling are weak.
- The bill of material is very incomplete, causing difficulty to plan efficiently and making inventory of spares impossible to do correctly.
- The roles of planners, frontline leaders, operations-maintenance coordinators, and reliability engineers are unclear and not followed.
Success requires long-term, consistent, visible, and caring leadership. Too many initiatives are started and not finished before they are changed or replaced. Leadership needs to include the plant manager. The right people are also needed to drive the change, including the frontline organization, to support well-developed, documented and followed processes. Repeated assessments will drive and sustain improvement.