TEDD POWERS
Determining the value of a business requires an in-depth analysis of the current and future financial state of the company, along with a solid understanding of its markets and the specific environment in which it operates. As a certified valuation analyst, I was trained to measure the value of a firm based on three key areas:
• Cash flow generated by the business
• Growth of that cash flow
• Risk associated with the cash flow
A valid valuation of any business requires math… and math is hard. Perhaps because math is hard—but probably more likely because a true business valuation takes time—many managers, owners and analysts fall into the trap of using a “multiple” approach to valuation. The value of any business, the multiple approach says, can be easily and quickly calculated by picking some financial measure—like revenue or gross profit—and multiplying it by some common factor.
 For example, insurance agencies have for years been valued at two times the annual premium revenue. Really? Does every insurance agency have the same expenses associated with producing premiums? What about growth: Does every agency grow at the same rate? Of course not. But the multiple approach assumes all things are equal. This makes it easy to use, but also completely wrong.
Let’s say that you are interested in leaving your current job and buying a small insurance agency. The Acme Group and United Agency are both for sale and each has annual premium revenue of $1 million. The multiple approach says that both agencies are therefore worth $2 million. But Fig. 1 shows just one reason why the multiple approach doesn’t work.
The Acme Group has been growing and is projected to continue to grow about 5 percent per year, while the United Agency’s revenues have been shrinking by about the same amount and are forecasted to continue to decline. Would you pay the same for either agency? If you answered yes, I have an insurance agency I’d like to sell you.
Clients at Fisher International are large pulp, paper, or packaging producers and their suppliers. Many of these clients are publicly-traded companies that report their earnings each quarter, and we listen to as many of their earnings calls as we can. On these calls, we hear company executives and the Wall Street analysts who cover them talk extensively about EBITDA: earnings before interest, taxes, depreciation and amortization. Analysts ask questions about the company’s EBITDA in both absolute dollar terms or as a percent of sales, so-called EBITDA margin. Every call, every news release, every investor presentation, it’s EBITDA, EBITDA, EBITDA!
 Yet the use of EBITDA as a proxy for the health of a company is not without its critics. Warren Buffett thinks it is, well, “stupid.” Mr. Buffett not only thinks EBITDA tells an incomplete story, he thinks it tells very little, if
  anything, about the true value of a company. He said, “When Wall Streeters tout EBITDA as a valuation guide, button your wallet.” I suspect managers keep talking about it in large part because analysts keep asking about it. It’s easy to compare the EBITDA margins of competing firms and draw conclusions about how effectively the managers are running the business. But just like the multiple trap, using EBITDA margins as a metric can lead you to exactly the wrong conclusion.
Let’s use an example based on recent events in the pulp and paper industry. Company A built a new, state-of-the-art paper machine that has one of lowest cash manufacturing costs in its space. The EBITDA margin for product from this machine is an eye-popping 32 percent. Company B converted an older machine by replacing the headbox and former and changing the dryer section, which resulted in a cash manufacturing cost of US$20 per ton higher than Company A, but still yields a very respectable EBITDA margin of 28 percent.
If that is all I told you, you would rightly conclude that Company A was in a better financial position and likely more valuable than Company B. But, I forgot to tell you that Company A spent $400 million on its new machine while Company B spent only $135 million on its conversion project. Figure 2 shows that, while the owners of Company A are realizing less than 1% return on their investment, owners of Company B are enjoying an outstanding 28% internal rate of return. Which company do you like now?
DISTORTED REALITY
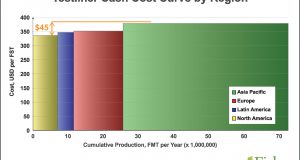
Let’s look at another example of how focusing on only part of the picture can give a distorted view of reality. The cost curve in Fig. 3 from FisherSolve demonstrates the cash cost position of a group of recycled linerboard producers. It reflects only the direct costs of production and does not consider the costs of the capital investment required to produce the tons. Here we see that Mill #1 is a mid-2nd quartile producer and has a slight cost advantage over Mill #2.
But when we asked FisherSolve to include the costs associated with owning and maintaining the equipment and facilities used in the course of production, we see a very different picture (Fig. 4). Mill #1 shifts from the 2nd to the 4th  quartile and Mill #2 becomes much more attractive. Understanding a company’s total cost is critical to evaluating its long-term competitiveness.
Using EBITDA as a measure completely ignores the cost of the capital investment required to generate operating income. I fear that the seemingly exclusive focus on EBITDA and EBITDA margin leads to bad decisions and the destruction of capital. Perhaps this is a contributor to the relatively poor performance of pulp and paper industry stocks over the long term. Certainly, many companies have seen their stock prices increase in recent times, but if we take a longer view we see a different story.
 Figure 5 shows the performances of three benchmarks: the S&P Global Timber and Forestry Index, which is comprised of the world’s 25 largest paper, packaging and forest products companies; the S&P 500, a measure of the broader economy; and the 10-Year United States Treasury Bond.
Ten years ago, if you had invested $100 in the forest products industry and allowed your dividends and stock splits to be reinvested in the industry, you would have about $131 today—an annual rate of return of 2.8 percent. If you had made the same investment in the S&P 500, you would have $211 today for an annual return of 7.7 percent. With each of these investments, you were exposing your money to risk. You could have lost everything. Of course, the return an investor expects to receive is directly linked to the risk to which her investment is exposed. The risk associated with investment in the pulp and paper industry—as measured by the standard deviation of the returns—was 55 percent higher than the S&P 500 over the last 10 years. Yet, the annual return on the investment in the pulp and paper industry was nearly 65 percent less than the broader market. Perhaps even more striking is the reality that you could have invested your $100 in the risk-free 10-year Treasury bond and gotten a higher return than from the pulp and paper industry.
What is the take-away from all of this financial alphabet soup? For me, it is that there are no shortcuts to measuring the financial health of a company. While valuation multiples and financial proxies like EBITDA are easy to calculate, they often lead to incorrect conclusions by people who are evaluating the performance of the managers running the companies they follow; they also may lead to bad decisions by those managers seeking to satisfy “the market” with impressive EBITDA margins.
It is the future cash flow generated by a company—viewed in the context of the associated risk—that determines the value of a business. Hopefully, analysts and market watchers can step back from the narrow view of multiples and margins to get a more complete picture of the total financial performance of companies. Perhaps this will encourage and allow managers to focus on the true drivers of enterprise value.
Tedd Powers is a senior consultant with Fisher International, a consulting firm that supports the global pulp and paper industry with business intelligence and data-driven strategy consulting. The information and analyses for this article are drawn from FisherSolve™, the industry’s premier market intelligence database and analytics resource. To learn more, please visit www.fisheri.com. Tedd Powers can be reached at tpowers@fisheri.com.
 Paper 360


