MATT ELHARDT, FISHER INTERNATIONAL
China and the United States are the two biggest containerboard markets in the world, accounting for 50 percent of the world’s total production of the grade between them. Yet China’s capacity has grown rapidly since 2007 (about 10 percent per year), while that of the US has remained fairly flat (Fig. 1 tracks capacity trends for each country over the past 10 years).
 More recently, China has been slowing from the very rapid growth that characterized the early part of the century (Fig. 2), and this has led to significant overcapacity.
 Operating rates have fallen from the 2008-09 levels, though more as a result of investment in new capacity than any drop in demand.
Whereas the US took 50-60 years to evolve, China has essentially built its market in the past 20 years. Nine Dragons Dongguan, a single mill in China, has built twice as many machines as the entire US since 2000.
The rapid growth has led to far more fragmented capacity in China than in the US (Fig. 3). In the US, four companies have a dominant share and there are only 29 producers in total. In China, there are only two producers with a significant percentage share of output (30 percent between them) and a total of 191 producers, more than half of them with less than 1 percent of the capacity. This clearly leads to far more volatility in the market.
 As Fig. 4 illustrates, Chinese and US containerboard product mix and channel dynamics are quite different. In the US, virgin kraftliner accounts for about half of all production, followed by recycled corrugating medium, recycled
  liner, and other grades. Most of this (70 percent) is integrated into box plants, with half of the rest open for forward sales and exports (nearly all of it virgin kraftliner).
China is much more skewed to recycled grades, which account for almost all output: half corrugating medium, around 40 percent recycled liner, with the rest made up of recycled white-top liner and other grades. Sales channels are also completely different from those of the US, with only 20 percent integrated and almost all the remaining 80 percent going to independent box plants, while exports are virtually zero. This creates a lack of flexibility for Chinese producers, who cannot easily divert production to another outlet if demand changes.
China imports almost all of its OCC from the US and Europe. This means it is not logical that Chinese producers could become exporters in the foreseeable future, processing imported wastepaper at significant cost only to ship finished product back to the countries that provided the raw material. In other words, China has invested in new capacity to serve the local market.
 Given this fact and recent operating rates—down to around 80 percent today—we would expect prices to be on the floor. In the past couple of years, prices have been at about 3000 RMB (about US$437) per ton, which is the floor price, defined here as the price at which enough producers can make a profit to satisfy overall demand (i.e., the most efficient 80 percent of producers).
Because China relies so heavily on imported OCC, its cost structure is generally higher than that of the US. Its fiber costs tends to be about US$30 per ton higher. China’s greater use of OCC rather than virgin fiber also leads to other higher costs—additive starch, strength aids, chemical—to compensate for the lower quality of the recycled material.
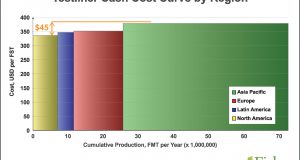
There is less of a cost difference between mills in China than those in the US (Fig. 5). In the US, the average cost difference between any mill and that above or below it on the cost curve is US$1.70 per ton. In China, there is only a US$0.60 difference. As a result, there is more of a margin difference to be made in the US than in China by rebuilding machines to reduce costs. And US machines are much older than those in China—older technology, plus a steeper cost curve, leads to more rebuilds (Fig. 6).
The two countries also experience wide differences in labor costs. In China, there are on average more than 400 employees at a given site, nearly double the US average. As a result, productivity per person in China is only 550 tons, less than a third of the 1,748 tons found in the US. Compensating for this in cost terms is the fact that, on average, Chinese wages are around US $10 per hour, compared to US $40 per hour in the US. This clearly offers an incentive to run leaner in the US.
 Despite the overall flat production cost curve in China, there is a wide gap in fixed costs between the highest and lowest cost producers. Building wide-scale machines could therefore still be attractive and, indeed, may offer a better
  return on investment than a greenfield mill in the US.
As a result, we might still expect to see new mills coming on stream in China in the near future. FisherSolve data show that, despite low operating rates, China has announced plans for 11 million tons of new capacity in the next two years (Fig. 7). Some of these projects may not come to fruition, but there is still a drive to add capacity.
We should remember too that, though China is going through a period of slower growth, this is a cyclical industry. It is important to note that the new machines under construction in China today are 20-40 percent wider than those already in operation, which should give them a significant fixed cost advantage.
Chinese wage growth has been phenomenal, tripling over the past few years (Fig. 8). Projecting wage growth into the future, it is clear that wage inflation will have a much greater impact on lower productivity machines. As wages increase in China, there will be greater pressure on producers with smaller machines.
The three largest producers are already fairly low cost in China. It is unlikely that they will see any advantage in buying smaller producers with higher cost structures, so M&A is not likely to be a big feature in the market, but new low-cost machines in the first or second quartile will tend to push out higher-cost operators. To the extent that the new machines are added by the larger producers, the industry will tend toward consolidation.
Matt Elhardt is VP business development, Fisher International, a consulting firm that supports the global pulp and paper industry with business intelligence and data-driven strategy expertise. The information and analyses for this article are drawn from FisherSolve, the paper industry’s premier market intelligence database and analytics resource. To learn more, visit www.fisheri.com. Matt Elhardt can be reached at [email protected]
 Paper 360


