With a surging increase in carbon markets, why is it imperative for P&P players to source reliable carbon benchmarking?
The term ESG was coined around 2005, although it was another full decade before it became a standard part of the Wall Street lexicon. Today, communicating the ESG message is so paramount that it is often intertwined with a company’s strategy or mission statement.
While the “S” (Social) and “G” (Governance) hold significant importance and value, we believe that the “E” (Environmental) in ESG comes first and is most important from an investor standpoint because carbon intensity, water use and quality, climate impacts, and sustainability are top of mind in a world buffeted by extreme weather events, pandemic responses, and supply chain constraints.
We believe carbon will be the lightning rod, as this will likely be the key to any environmental scorecard moving forward because it already has a slew of targets; plus, impacts can be seen and smelled and aren’t tolerated in their immediate communities. While addressing long-term issues takes a generational investment approach, identifying and sanctioning breaches of standards or unacceptable behavior can be done in real time. As we’ve consistently stated, it’s not a matter of if carbon costs will impact manufacturers’ bottom lines, but when they will become permanent. With the P&P industry making up one of the top five industrial categories that contribute to the most greenhouse gases emitted, carbon costs could have a significant impact industry-wide.
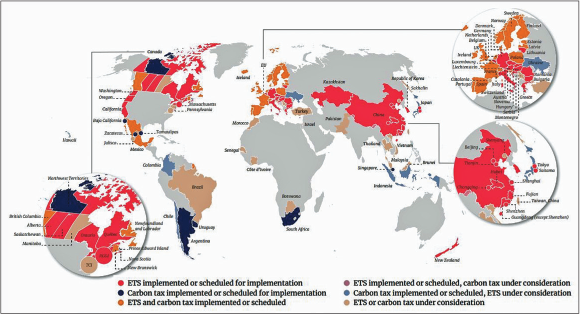
More governments are adopting net zero targets, which means we are beginning to see more announcements and implementations of carbon pricing schemes, as illustrated in Fig. 1. The most common forms of current carbon pricing are either carbon taxes or an Emission Trading System (ETS)—the two main forms being either a cap-and-trade system or a baseline-and-credit system.
- A carbon tax: A company or region pays for the amount of CO2 they produce, meaning market forces essentially determine emissions reductions.
- A Cap-and-Trade ETS: The government sets a benchmark or limit for the amount of carbon that can be emitted, and issues permits to emitting companies within these limits. These permits can either be bought or sold by companies.
- A Baseline-and-Credit ETS: Baselines are set for regulated emitters and if those emitters go over their set baseline, they must surrender credits to make up for it. However, those who have reduced emissions below their baseline receive credits, which they can sell to other companies.
Recently, analysts at Refinitiv, an American-British global provider of financial market data, stated that the value of traded global markets for CO2 permits last year increased by 164 percent to a record EUR760 billion (almost US$775 billion). The late 2021 global spike in natural gas prices, which led to more coal power generation and an increased demand for permits, was a main cause; yet an even larger factor was at play that contributed to this increase in value: the European Union’s ETS.
HOW THIS IMPACTS THE P&P INDUSTRY
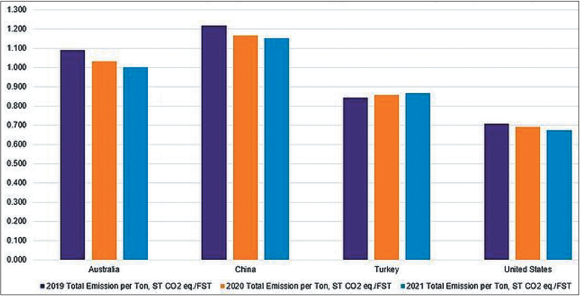
As illustrated in Fig. 2, the amount of carbon emissions produced per ton of paper in several global markets remains relatively high and hasn’t decreased significantly—if at all—over the last three years. Some countries, such as Turkey, have even increased levels over the last three years.
With the rise of carbon pricing mechanisms, the cost of doing business will ultimately increase for manufacturers located within these high emitting regions. In addition to higher prices, these manufacturers could also potentially lose the business of retailers and companies who are focusing on their own individual carbon footprints, which forces them to evaluate the carbon claims of their own suppliers, transport systems, etc., to achieve sustainability goals.
With procurement-level decisions now being made with regard to the sustainability of suppliers, which is critical for the energy-intensive pulp and paper industry, potential customers are comparing carbon impacts of individual mills and requesting information about the upstream carbon footprint.
Global brands want to decrease their carbon footprints. This begins with an accurate measurement; however, it is easier said than done for a number of reasons.
First, precise reporting is difficult. Emission calculations can and are being reported over or under by as much as 50 percent. “The measurement, target-setting, and management of Scope 3 is a mess,” says Anant Sundaram, a finance professor at Dartmouth College’s Tuck School of Business. “There is a wide range of uncertainty in Scope 3 emissions measurement … to the point that numbers can be absurdly off.”
Second, it doesn’t appear that a Life Cycle Analysis (LCA) is enough. Per the Organization for Economic Development: there is no single LCA method that is universally agreed upon; different boundary definitions will produce very different results; and there is a lack of comprehensive data for LCAs, meaning there would be reliance on questionable assumptions and databases. And in many cases, the cost of the LCA data available is at too high of a level to enable large brands to make actionable decisions on specific products. Additionally, with more than 3,500 mills producing hundreds of mill-paper combinations worldwide, can we really expect an LCA for millions of combinations to be feasible?
So, what are some attributes of reliable carbon benchmarking for participants in the pulp and paper value chain? Here are three primary principles:
- Modeling is consistently applied.
- The model is based on the fundamentals of pulping and papermaking: a mill’s assets and process (no individual mill ever runs the same year-to-year).
- The model enables segmentation by product and company and considers various supply chain configurations.
At Fisher, we believe this problem can be solved by applying sophisticated analytics to our comprehensive datasets that describe every pulp and paper mill in the world. By taking a systematic approach and basing our models on fundamentals, we can correct the issues found in much of the carbon emissions reporting and provide an “apples-to-apples” comparison for consumers.
BUILDING THE MODEL
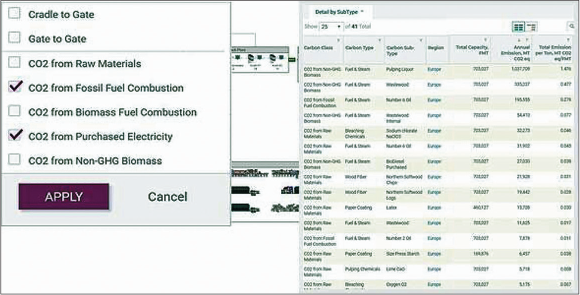
Our model starts with a fundamental view of a mill’s capacity, grade mix, and process flows’ given constraints. Once a carbon benchmark is built from the primary principles (Fig. 3), methodology is applied consistently to all paper machines in the database. By linking mill and asset data together, it enables us to understand the “why” of it all.
HYPOTHETICAL USE CASE
To make better sense of this, let’s look at a hypothetical use case. Selling more than 474 million products over the last year, Apple has had to use an equivalent amount of packaging to distribute its products to its customers, meaning a lot of folding boxboard (FBB) was created for Apple alone. For our hypothetical use case, we are going to see what kind of carbon impacts shipping FBB to Vietnam has and what possible decisions companies in Vietnam could make based on this information.
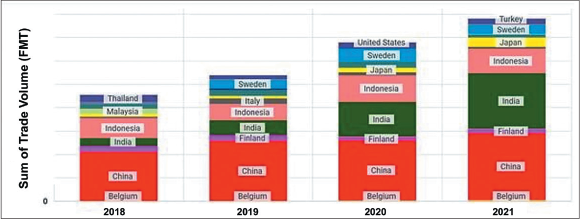
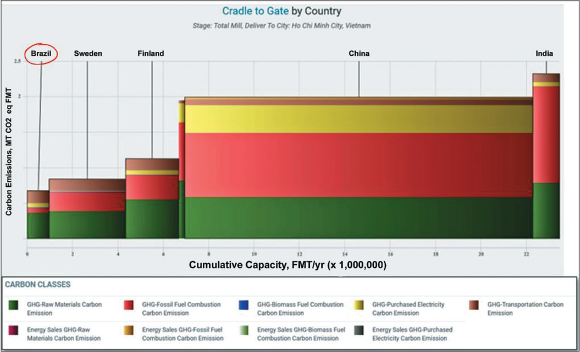
As we can see from the 2021 data in Fig. 4, China, India, and Indonesia are among the top exporters of FBB to Vietnam. Next, when comparing the carbon emissions of some of these countries, we can see that FBB mills in China and India, on average, have nearly twice the carbon intensity compared to Finland and Sweden.
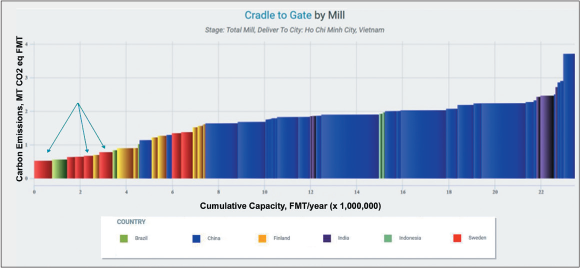
This type of carbon benchmarking can be used by an end user to determine if new suppliers (and in this hypothetical case, mills in Brazil—see Fig. 5) would lower that end user’s GhG impact. However, when we look even closer at the individual mill level, we can see there’s actually a Swedish mill that has an even lower modeled GhG impact (see Fig. 6).
In this case, our hypothetical buyer can use both costs and carbon models to inform their decision-making.
Moving forward, corporations will be expected to articulate their ESG strategies as part of a social license to operate. They must do this while also maintaining their reputations with the public and nurturing relationships with consumers in order to access capital markets. Those that do it well will participate in a virtuous feedback loop with their communities, customers, and shareholders, and those that don’t will destroy value—a breach of their primary fiduciary duty.
 Paper 360

