URBAN LUNDBERG
In a poll conducted by JP Morgan, 71 percent of global fund managers representing US$12.9 trillion in assets recently stated that they believe the coronavirus pandemic would lead to an increase in actions designed to tackle climate change and bio-diversity losses, which has created focus around ESG and impact investing. Some major brands that have committed to ambitious zero carbon targets (and the year by which they intend to achieve them) include Apple by 2030, Amazon by 2040, Unilever by 2039, Starbucks by 2050, and Nike by 2050.
As the momentum behind this movement continues to gain traction, the question is no longer a matter of if carbon costs will hit your bottom line, but when they will hit. Carbon costs are coming, and it is now evident that optimized sourcing in the future will require consideration of both traditional and environmental costs.
AN ‘ENFORCEMENT MECHANISM’
Since being elected as the 46th president of the United States, President Biden has rejoined the Paris Treaty on Climate Change and has also promised an “enforcement mechanism” to limit carbon emissions to achieve his pledge to cut US greenhouse emissions (GhG) in half by 2030. He has also selected Janet Yellen as the new secretary of the treasury, who has been vocal about her support for a price on carbon as a way to drive reductions.
While no policy has been formally established to date, the administration has said that a system targeting sector-specific standards, similar to California’s ETS “cap and trade” scheme, is preferred. However, this initiative is an effort to catch up with many other countries who have already established systems to reduce GhG emissions.
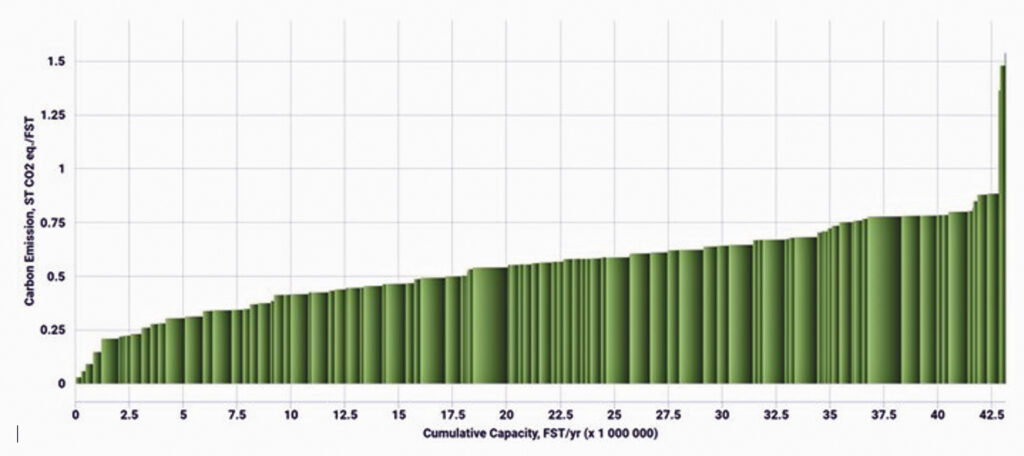
If carbon fees, or their equivalent, are established, the enforcement could create wide differences in costs for pulp and paper mills and their suppliers. As illustrated in Fig. 1, some of the highest emitting containerboard mills in North America are producing four times as much carbon compared to their competitors—and this is just one segment within the very diverse pulp and paper industry.
While we don’t yet know which manufacturing segments and companies will be impacted the most, how much current emissions could cost, etc., we do know that carbon taxes will definitely increase the cost of doing business for many manufacturers.

The United States is a fairly high emitter of carbon compared to the rest of the world, specifically compared to Europe, which has long been ahead of the game in reducing emissions. The US averages around 1.3 metric tons of CO2 per metric tons of finished product, while Europe and Latin America average less than 1 metric ton of CO2 per metric ton of finished product. Many mills use fossil fuels to create energy and power their facilities, which are emitting a considerable amount of CO2. But are high emitting mills necessarily creating higher quality products?
During the peak of the pandemic, there was a temporary phenomenon that drove a spike in retail tissue demand driven by consumers stocking up their home supplies. Demand in the tissue and towel segment skyrocketed, driven in part by demand for high-quality at-home tissue. While demand has now stabilized, North American consumers continue to favor ultra-premium products at home. When looking at previous economic recessions, consumers usually step down to value or economy brands. But during the Great Recession in 2008, consumers continued to buy the highest performance tissue available despite tough economic circumstances—a trend we’ve seen continue through the pandemic.
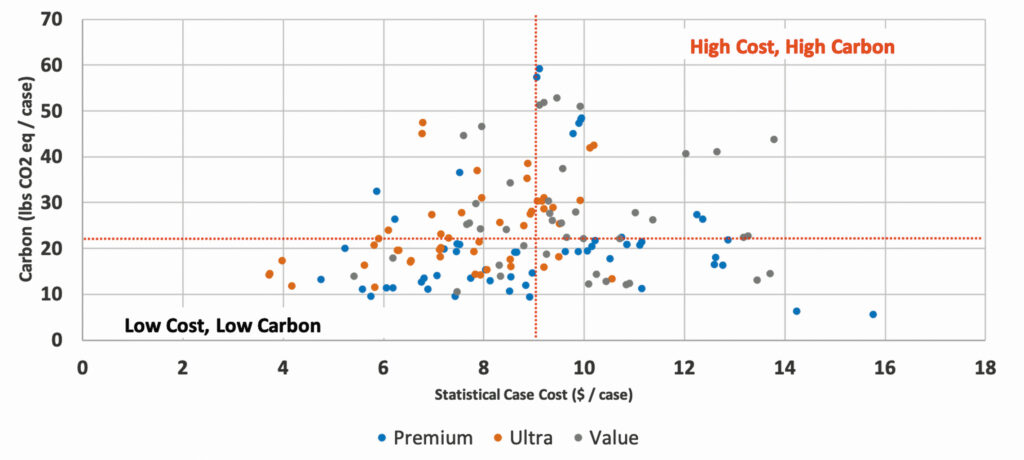
In Fig. 2, the horizontal axis shows the average statistical case cost for every tissue machine in North America categorized by premium, ultra, and value product capability; the Y-axis illustrates carbon emission. As the data show, the lower manufacturing cost machines are mainly premium and there is a 20-lbs CO2 emissions/case difference between the highest and lowest cost machines, which is critical to understand because these are two extremely valuable criteria for consumers.
Other types of machines to consider are advanced tissue machines (TAD, ATMOS, NTT, and similar) versus conventional machines. Advanced machines produce premium and partly ultra products and tend to have higher carbon emissions compared to conventional machines by weight, but not in product usage (Fig. 3). Tissue that is produced on advanced tissue machines has about 20 percent less fiber (therefore, less weight per case) than tissue produced on conventional machines. This means that the high carbon emissions that are created when producing tissue with advanced technology can and must be compensated for with lower fiber usage.
REGIONAL DIFFERENCES
While Europe’s industrial and manufacturing sectors are at the forefront of lowering carbon impacts, many other regions are beginning to catch up. The Chinese government, for example, issued Guiding Opinions on accelerating the establishment of a green, low carbon circular economic system. The goal of this system is to peak emissions before 2030 and to achieve carbon neutrality by 2060, which has been criticized by many for not being aggressive enough.

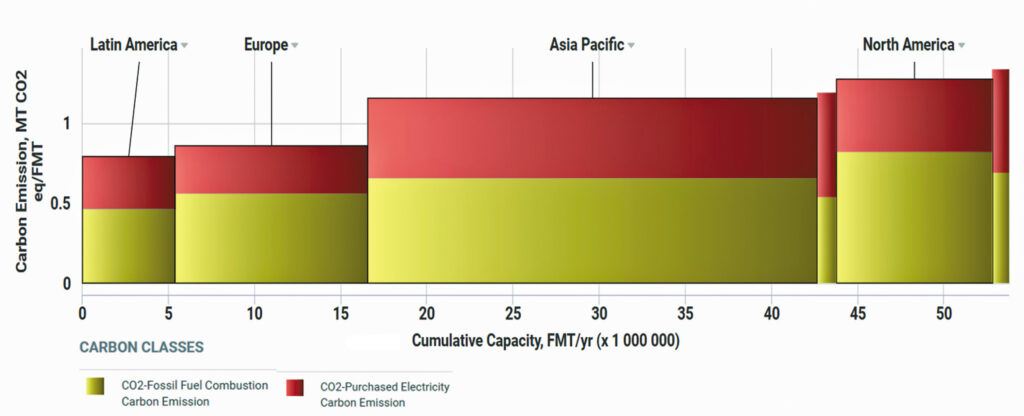
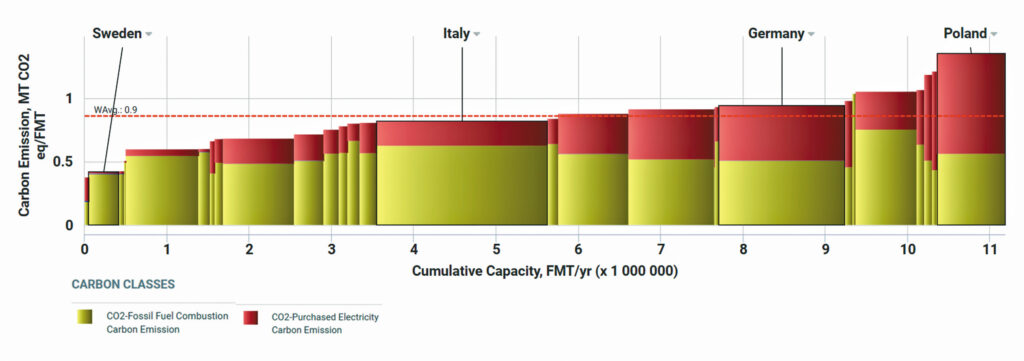
Looking specifically at the tissue segment again, we can see in Fig. 4 that European and Latin American tissue producers have significantly lower carbon emissions than those in both Asia and North America. However, within Europe, there is a relatively large carbon spread between countries with up to a 3x difference between the lowest and highest emitters. Figure 5 illustrates this spread, which is mainly driven by their different fuel uses.
This prompts an obvious question about carbon implications associated with inter-regional tissue trade. As we can see in Figs. 6 and 7, the leading countries exporting tissue to Europe have significantly higher carbon emissions, because transportation emissions are included as well. Could carbon costs in the future impact global trade in this segment?
While Europe is ahead of the game in reducing carbon emissions and implementing carbon-related policies, other countries are catching up. In the near- and mid-terms, the tissue industry will likely evolve into an even more regional business segment than it is today because the long distances between markets and producers can add significant cost not only in transportation, but also in associated carbon fees.
Legislative initiatives to curtail carbon will increase, but the strongest demand for change will likely come from retailers in the near-term and from end-users in the mid-term. However, individual carbon footprints will play an ever-increasing role for investment decisions in the future.
With respect to possible climate change regulation, the pulp and paper supply chain must be aware of what could potentially be coming down the pike, especially as younger generations enter the workforce and make up an increasingly larger share of consumers who make purchasing decisions based on environmental concerns. As the most discerning customers in history, will they care if a tissue product creates 20 lbs more GhG emissions per case than another product? We don’t know the answer to this question yet, but tissue manufacturers need to be prepared to satisfy consumers with a broader range of decision-making criteria that address such concerns.
Urban Lundberg is senior consultant, business intelligence, Fisher International. For more data and insight into the present and future state of the pulp and paper industry, contact Fisher International at fisheri.com.
 Paper 360